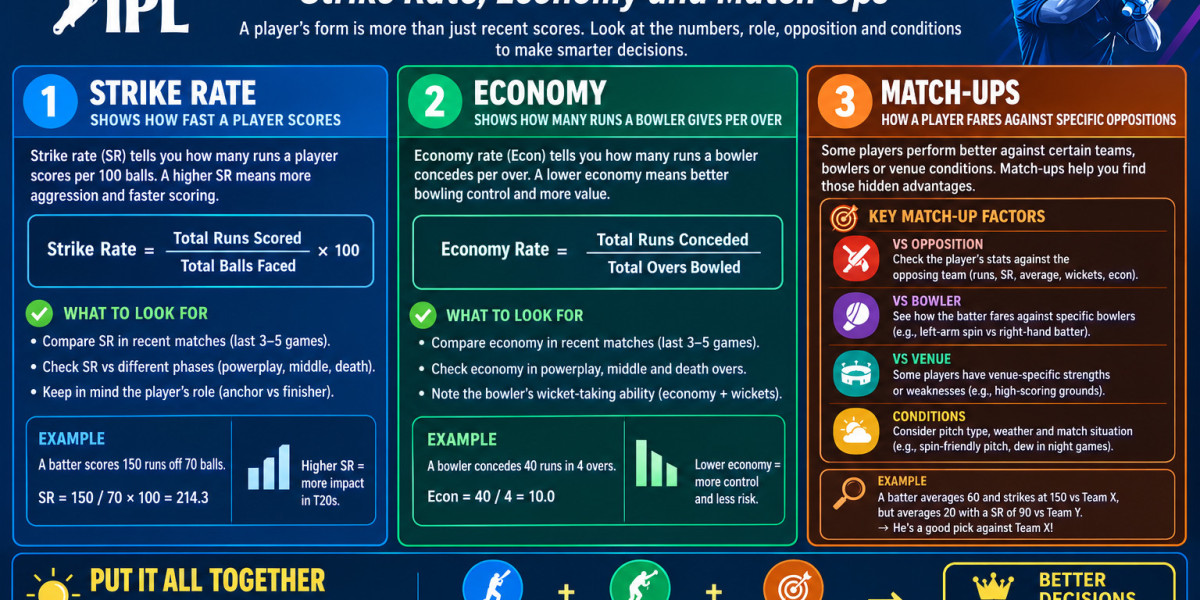

Form is not one number. A batter can have a high strike rate and still be out of form. A bowler can have a good economy and still be a problem. A player can look great against one team and struggle against the next, for a reason that has nothing to do with confidence.
The trick is to look at three things together: what the player is supposed to do, how they have done it recently, and who they are up against next. Strike rate, economy and match-ups are the three tools for that job, but only if you use them in pairs, not on their own.
Step 1: Start with role, not with runs
Before you look at any number, ask: what is this player's job in this team, in this match?
An opener's job is different from a finisher's job. A powerplay bowler's job is different from a death bowler's job. A player who changes role will change numbers, even if his form has not changed.
Vaibhav Sooryavanshi is the best recent example. At No. 3 in Christchurch, he scored 4 off 8 balls. As an opener in Wellington, he scored 45 off 19 balls in a 133-run stand with Abhishek Sharma. His form did not suddenly improve overnight. His role changed to the one that suits him: opening, where he can attack from ball one.
Tilak Varma is the opposite example. At No. 3, he is expected to build an innings. As a finisher in Christchurch, he scored 51 not out off 26 balls from 112 for 6, with a different job: rescue, then finish. Judging Tilak only by his No. 3 average would miss his finishing value.
For bowlers, role matters even more. A bowler who bowls in the powerplay will usually have a higher economy than a bowler who bowls in the middle overs, because batters attack in the powerplay. A death bowler will usually have a higher economy than a middle-overs spinner, because batters attack at the death. Comparing their economies directly, without role, is misleading.
So step one is always: opener or finisher, powerplay or death, spinner or pacer, and has that role changed recently?
Step 2: For batters, use strike rate and average together
Batter strike rate is simple:
Strike rate = (Runs scored divided by Balls faced) multiplied by 100
It tells you how fast a batter scores, not how often he gets out.
Abhishek Sharma's 113 off 38 balls in Wellington gives a strike rate of 297.37. That is an extreme example, but it shows the point: 113 runs in 38 balls is not just a hundred, it is a hundred at almost three runs per ball.
Average tells you the other half: how often a batter gets out, and how many runs he scores per dismissal.
Average = Runs scored divided by Times dismissed. Not-out innings do not count as dismissals, which is why a finisher who often finishes not out can have a high average without scoring big hundreds.
Use them together, like this:
- High strike rate, high average: in form, and scoring quickly. This is the ideal, and it is rare.
- High strike rate, low average: dangerous, but inconsistent. The batter hits boundaries, but gets out early too often.
- Low strike rate, high average: reliable, but slow for T20. Useful in a rescue, less useful as an opener on a flat pitch.
- Low strike rate, low average: out of form, for now.
Two other batter numbers help, if you have them: balls per boundary, and dot-ball percentage. A batter who hits a boundary every five balls but also plays many dot balls is different from a batter who rotates strike and hits a boundary every eight balls. The first is boom or bust. The second is steadier.
In T20, as a rough guide, not a rule, an opener with a strike rate above 140, a middle-order batter above 130, and a finisher above 160 are all doing their job, if their average is also healthy. On a slow, grippy pitch like Raipur in the women's series, those numbers will be lower for everyone, and that is normal. Always compare a strike rate to the pitch and the match, not to an ideal number.
Step 3: For bowlers, use economy, strike rate and average together
Bowler economy is:
Economy = Runs conceded divided by Overs bowled
It tells you how many runs a bowler gives away per over. Lower is better.
Bowler strike rate is different from batter strike rate, and this confuses many fans:
Bowler strike rate = Balls bowled divided by Wickets taken
It tells you how often a bowler takes a wicket, in balls. Lower is better. A bowler who takes a wicket every 12 balls has a better strike rate than a bowler who takes one every 24 balls.
Bowler average is:
Average = Runs conceded divided by Wickets taken
Lower is better.
Use all three together:
- Low economy, low strike rate: the ideal bowler. He does not give away runs, and he takes wickets regularly.
- Low economy, high strike rate: a containing bowler. He builds pressure, but does not take wickets himself. Useful in the middle overs, less useful when you need a breakthrough.
- High economy, low strike rate: a wicket-taker who goes for runs. Useful at the death, where wickets matter more than economy, but risky in the powerplay.
- High economy, high strike rate: out of form, or bowling in the hardest phase without success.
Mitchell Santner in the second Christchurch match is a good example. He took four wickets for 21 runs in four overs, an economy of 5.25, with a strike rate of six balls per wicket. That is low economy and low strike rate together, which is why his spell changed the match, taking India from a comfortable chase to 70 for 5 and then 112 for 6.
Arshdeep Singh in the same series is a different example. He did not always take many wickets in a match, but his control, for example one for 33 in Wellington, kept New Zealand to 63 runs in the final seven overs after they were 123 for 3 after 12 overs. His value in that match was economy and control, not just wickets.
Jasprit Bumrah in the 2026 World Cup final is the extreme example: four for 15 in four overs, an economy of 3.75, with a strike rate of six balls per wicket. That is why he was Player of the Final. He did not just take wickets. He took them cheaply.
Step 4: Match-ups: who against whom, and where
A match-up is a simple question: how does this batter do against this type of bowler, and how does this bowler do against this type of batter?
There are four match-ups to check first:
Pace vs spin. Some batters attack pace but struggle against spin, or the opposite. A batter who scores quickly against pace but slowly against spin will struggle in the middle overs, when spinners bowl. A bowler who is a spinner will be more valuable against a team with many pace-hitting batters.
Left vs right. Left-handed batters often face different angles from right-arm pacers and left-arm spinners. A left-arm pacer who swings the ball away from a right-handed batter may swing it into a left-handed batter. That is why teams track left-right match-ups separately, not just overall averages.
Specific bowler vs batter. Some match-ups are personal. A bowler may have dismissed a batter three times in 10 balls, or a batter may have scored 40 runs off 15 balls against a particular bowler. That history matters, but only if the sample is large enough.
Phase and venue. A batter who scores at 160 in the powerplay but at 120 at the death is a different player in different phases. A bowler who is excellent at Eden Park, with short straight boundaries, may struggle at a larger ground. Always check phase and venue, not just overall numbers.
In the current IND vs NZ series, two match-ups stood out. Santner against India's middle order in Christchurch, where his spin in the middle overs took four wickets and forced Tilak into a rescue innings. And Arshdeep against Tim Seifert in the same match, where Arshdeep dismissed Seifert in the second over, before Seifert could settle.
Both match-ups were about phase as much as skill. Santner bowled in the middle overs, when India were rebuilding. Arshdeep bowled in the powerplay, when Seifert was trying to attack. The same bowler in a different phase might have had a different result.
The sample size warning
Match-ups are powerful, but they are also easy to misuse. A batter who has faced a bowler for only six balls and scored 12 runs does not have a "match-up advantage". He has a small sample.
As a rule, treat a match-up as useful only if it has at least 20 to 30 balls, or several meetings across different matches and venues. One innings, one over, or one dismissal does not make a trend.
The same warning applies to recent form. One hundred does not make a batter in form, and one duck does not make him out of form. Look at the last five to 10 innings, not the last one.
Step 5: Recent form vs career form
Career average tells you who a player has been. Recent form tells you who he is now.
Use both, in this order:
First, look at the last five innings or matches. Are runs, strike rate, wickets and economy moving up, down, or staying flat? A player with three good matches in a row is in better recent form than a player with one good match after four poor ones, even if their career averages are similar.
Second, look at the last 10 innings. This smooths out one bad match and shows a trend, not a blip.
Third, compare recent form to career form. If recent strike rate is much higher than career strike rate, is that because of a role change, a flat pitch, or a genuine improvement? If recent economy is much worse than career economy, is that because of death bowling, injury, or loss of form?
Sooryavanshi again: his career as an opener, with a 35-ball IPL century and 175 in a U19 World Cup final, is different from his brief stint at No. 3. His recent form as an opener in Wellington, 45 off 19, fits his career as an opener, not his No. 3 numbers.
Tilak again: his rescue in Christchurch fits his recent form as a finisher, not just his career as a No. 3. If you only looked at his career average, you would miss that shift.
This middle section is where fans usually check form together, with recent numbers, match-ups and venue in one place. A platform like Cricbet99 is sometimes used for that kind of following, alongside official broadcasts. That platform is a gaming and betting-related service, so any related features are for adults only, where legally permitted, and analysing form does not require using any betting feature.
A simple 5-step checklist for Auckland and Hamilton
Use this checklist before the 4th T20I in Auckland on 30 October and the 5th in Hamilton on 1 November:
1. Role: Who opens, who finishes, who bowls in the powerplay and who bowls at the death? Has anyone changed role since Wellington?
2. Batter check: For each key batter, what is his strike rate and average in the last five innings, not just his career? Is he scoring quickly and staying in, or scoring quickly and getting out early?
3. Bowler check: For each key bowler, what is his economy, strike rate and average in the last five matches? Is he containing, taking wickets, or both?
4. Match-up check: Who does each batter struggle against, pace or spin, left or right? Who does each bowler trouble most? Is the sample large enough to trust, at least 20 to 30 balls?
5. Venue check: Eden Park has short straight boundaries and high scores. Seddon Park is different. Does the player's recent form fit this venue, or was it built on a different kind of pitch?
If you can answer those five questions, you can analyse form better than most scorecard readers, who only look at the last score.
Frequently Asked Questions
What is a good strike rate in T20 cricket?
For a batter, strike rate is runs divided by balls, multiplied by 100. As a rough guide, above 140 for an opener, above 130 for a middle-order batter, and above 160 for a finisher are good, but pitch and match situation matter more than a fixed number.
What is a good economy rate for a bowler in T20?
Economy is runs conceded divided by overs bowled. Under 7.5 is good, under 7.0 is excellent in T20Is, but powerplay and death bowlers will usually have higher economies than middle-overs spinners, because batters attack more in those phases.
What is the difference between bowler strike rate and batter strike rate?
Batter strike rate is runs per 100 balls, higher is better. Bowler strike rate is balls per wicket, lower is better. A bowler who takes a wicket every 12 balls is better than one who takes one every 24 balls.
What is a match-up in cricket?
A match-up is how a specific batter performs against a specific type of bowler, or a specific bowler, and vice versa. Check pace vs spin, left vs right, phase, venue, and sample size before trusting a match-up.
How many matches should I look at for recent form?
Look at the last five innings for a quick check, and the last 10 for a trend. One innings is not form, it is a single data point.
Why does a player with a high average sometimes have a low strike rate?
Because average measures runs per dismissal, not speed. A batter who scores 40 not out off 40 balls often will have a high average but a strike rate of 100, which is slow for T20. That is why you need both numbers together.
Final thoughts
Analysing form is not about finding one magic number. It is about pairing numbers that balance each other: strike rate with average for batters, economy with strike rate and average for bowlers, and recent form with match-ups and venue for both.
If you remember one thing, remember this: a number without a role, a phase and a sample size is just a number. A number with a role, a phase and a decent sample is form.
Use that checklist in Auckland and Hamilton, and you will see why Abhishek's 113 in Wellington was not just a big score, why Santner's four for 21 in Christchurch changed a match, and why Sooryavanshi's 45 as an opener tells you more about his future than his four at No. 3 ever could.